An ETL Story of U.S. Civil Aviation Accidents (1962-2023)
Noelia Manion
Aviation safety data is only as useful as the process behind it. Behind every dashboard or safety trend is a much less visible stage: extracting raw records, cleaning inconsistent labels, and transforming decades of scattered reports into something that can actually answer a question. This project walks through that process using U.S. civil aviation accident data spanning six decades, from 1962 to 2023, to understand how aircraft make, carrier, weather conditions, and phase of flight relate to incident and fatality patterns.
Rather than presenting only the final visuals, this DataStory documents the full ETL pipeline, extract, transform, and load, to show how raw, messy data becomes a reliable foundation for safety insight.
I. Extracting the Data

The dataset originated as a zipped CSV file sourced from Kaggle, unpacked using Python's zipfile module and loaded into a structured dataframe with pandas. An early attempt to use the NTSB's native database, distributed in .mdb format, was abandoned after it proved too dependent on external drivers to extract cleanly, a reminder that data availability often shapes methodology as much as the research question does.
II. Cleaning and Transforming
Six decades of aggregated safety reporting comes with inconsistency built in. Duplicate entries appeared under inconsistent capitalization (AMERICAN AIRLINES vs. American Airlines) and overlapping naming conventions (Delta Air Lines, Inc. vs. Delta Air Lines), both standardized through targeted string formatting and manual merges. Vague or placeholder entries, like "Pilot" or "On File", were filtered out to preserve the integrity of the analysis. From there, the dataset was grouped by aircraft make, carrier, weather condition, and phase of flight, narrowed to the top ten results per category to keep the analysis focused and legible.


A key transformation decision was analytical, not technical: fatality counts were tracked alongside incident counts, rather than incidents alone. Most aviation incidents are minor and successfully mitigated, so incident frequency by itself tells an incomplete story.
III. Loading and Visualizing
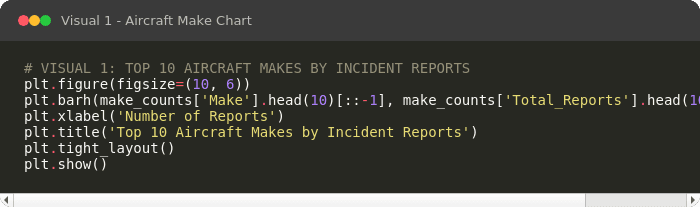
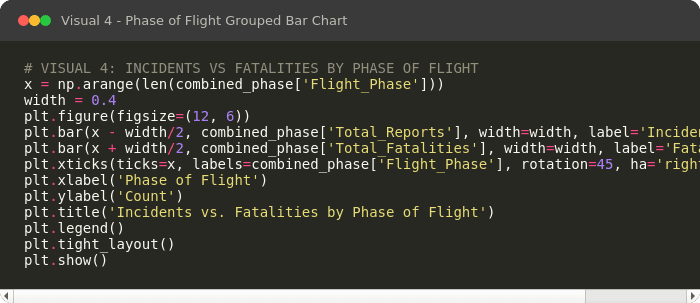
Using matplotlib.pyplot, the cleaned data was loaded into four visualizations: incident counts by aircraft make, incident counts by air carrier, incidents versus fatalities by weather condition, and incidents versus fatalities by phase of flight.



IV. What the Data Shows
Cessna, Piper, and Beech top the list of aircraft by incident count, but these are small, single-engine aircraft largely flown by private individuals, a pattern that reflects usage volume more than mechanical risk. Similarly, American, United, and Delta lead among carriers, likely a function of flight volume rather than relative safety.
Weather conditions tell a sharper story: most incidents occur in normal visibility (VMC), but a disproportionate share of fatalities occur under instrument-only conditions (IMC), when pilots rely on instrumentation rather than visual reference. Phase of flight follows a similar pattern, incidents cluster heavily around landing, but fatalities skew toward the cruise phase. Landing incidents are frequent but rarely fatal; cruise incidents are rarer but far more severe.
V. Working Through the Data
Beyond formatting inconsistencies, one of the more instructive challenges was recognizing when a dataset's limitations should redirect the approach, as with the shift away from the .mdb NTSB source. Applying conditional filters and iterative loops proved essential for surfacing clean, comparable categories out of decades of inconsistently recorded entries.
VI. Conclusion
This ETL process reinforces a theme that runs through aviation safety data more broadly: raw incident counts alone rarely tell the full story. Usage volume, aircraft age, operating conditions, and phase of flight all shape where risk actually concentrates, and untangling that requires the data to be cleaned and structured with care before any visualization can be trusted. What starts as a technical exercise in extraction and transformation becomes, by the end, a clearer picture of where aviation risk really lives, and where it doesn't.
VII. References
https://data.ntsb.gov/avdata
https://www.kaggle.com/datasets (aviation accident dataset)